852e62f01cc9dffd75cd065584f71a2601c6d389,mahotas/demos/nuclear.py,,,#,6
Before Change
labeled = mahotas.labeled.remove_bordering(labeled)
imshow(labeled)
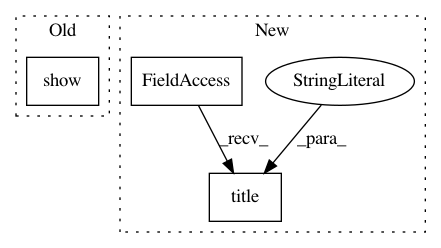
show()

relabeled, n_left = mahotas.labeled.relabel(labeled)
print("After filtering and relabeling, there are {} nuclei left.".format(n_left))
imshow(relabeled)
After Change
plt.subplot(3,2,2)
f = mahotas.gaussian_filter(f, 4)
f = (f> f.mean())
plt.title("gaussian_filter")
plt.imshow(f)


plt.subplot(3,2,3)

In pattern: SUPERPATTERN
Frequency: 4
Non-data size: 3
Instances
Project Name: luispedro/mahotas
Commit Name: 852e62f01cc9dffd75cd065584f71a2601c6d389
Time: 2019-05-18
Author: v0lt.lucas@gmail.com
File Name: mahotas/demos/nuclear.py
Class Name:
Method Name:
Project Name: nipy/dipy
Commit Name: 6c524d66dcd30d98a0f0c991252a3be644fa58ef
Time: 2013-09-11
Author: stjeansam@gmail.com
File Name: doc/examples/compute_SNR_in_corpus_callosum.py
Class Name:
Method Name:
Project Name: nipy/dipy
Commit Name: cf7d0bdc4133ea3248e054fa93aa2b5a6f8f2fca
Time: 2013-09-11
Author: stjeansam@gmail.com
File Name: doc/examples/compute_SNR_in_corpus_callosum.py
Class Name:
Method Name:
Project Name: chainer/chainerrl
Commit Name: 15ca33fae351f6978029f6078aad42612a99a8b6
Time: 2016-05-10
Author: muupan@gmail.com
File Name: plot_scores.py
Class Name:
Method Name: main
