57a14faee7b0198e056e474c04ea346d148a2835,cellprofiler/modules/identifyprimaryobjects.py,IdentifyPrimaryObjects,display,#IdentifyPrimaryObjects#Any#Any#,1194
Before Change
            orig_axes     = figure.subplot(0,0)
            label_axes    = figure.subplot(1,0, sharexy = orig_axes)
            outlined_axes = figure.subplot(0,1, sharexy = orig_axes)
            table_axes    = figure.subplot(1,1, sharexy = orig_axes)

            title = "Input image, cycle //%d"%(workspace.measurements.image_number,)
            figure.subplot_imshow_grayscale(0, 0,
                                              workspace.display_data.image,
                                              title)
            figure.subplot_imshow_labels(1, 0, workspace.display_data.labeled_image,
                                           self.object_name.value)

            if workspace.display_data.image.ndim == 2:
                // Outline the size-excluded pixels in red
                outline_img = np.ndarray(shape=(workspace.display_data.image.shape[0],
                                                   workspace.display_data.image.shape[1],3))
                outline_img[:,:,0] = workspace.display_data.image
                outline_img[:,:,1] = workspace.display_data.image
                outline_img[:,:,2] = workspace.display_data.image
            else:
                outline_img = workspace.display_data.image.copy()

            // Outline the accepted objects pixels
            draw_outline(outline_img, workspace.display_data.outline_image,
                         cpp.get_primary_outline_color())

            // Outline the size-excluded pixels
            draw_outline(outline_img,
                         workspace.display_data.outline_size_excluded_image,
                         cpp.get_secondary_outline_color())

            // Outline the border-excluded pixels in yellow
            draw_outline(outline_img,
                         workspace.display_data.outline_border_excluded_image,
                         cpp.get_tertiary_outline_color())

            title = "%s outlines"%(self.object_name.value)
            figure.subplot_imshow(0, 1, outline_img, title, normalize=False)

            table_axes.clear()
            table = table_axes.table(cellText=workspace.display_data.statistics,
                                     colWidths=[.7,.3],
                                     loc="center",
                                     cellLoc="left")
            table_axes.set_frame_on(False)
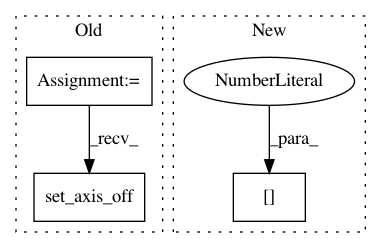
            table_axes.set_axis_off()
            table.auto_set_font_size(False)
            table.set_fontsize(cpp.get_table_font_size())

    def calc_smoothing_filter_size(self):
After Change
            figure.subplot_table(
                1, 1,
                [[x[1]] for x in workspace.display_data.statistics],
                row_labels = [x[0] for x in workspace.display_data.statistics])

    def calc_smoothing_filter_size(self):
        Return the size of the smoothing filter, calculating it if in automatic mode
In pattern: SUPERPATTERN
Frequency: 3
Non-data size: 3
Instances Project Name: CellProfiler/CellProfiler
Commit Name: 57a14faee7b0198e056e474c04ea346d148a2835
Time: 2013-03-18
Author: leek@broadinstitute.org
File Name: cellprofiler/modules/identifyprimaryobjects.py
Class Name: IdentifyPrimaryObjects
Method Name: display
Project Name: scikit-image/scikit-image
Commit Name: f877491f58df5667e65aff742f872625cb48df56
Time: 2016-06-07
Author: devel@sciunto.org
File Name: doc/examples/numpy_operations/plot_view_as_blocks.py
Class Name:
Method Name:
Project Name: scikit-image/scikit-image
Commit Name: 51f598aaedc73ef180913c670d2c20a8032aaf1e
Time: 2018-05-16
Author: egor.v.panfilov@gmail.com
File Name: doc/examples/edges/plot_random_shapes.py
Class Name:
Method Name:
