f25d4df0127537d57d4d7f7cd3fa52ca31ffa3ff,examples/03_connectivity/plot_multi_subject_connectome.py,,plot_matrices,#,18
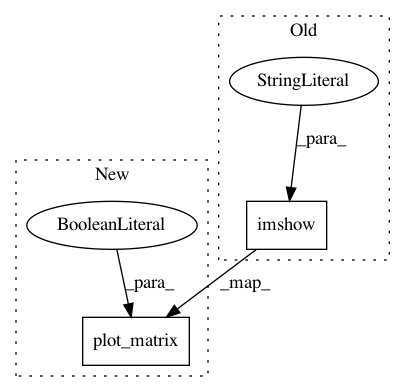
Before Change
    // Display covariance matrix
    plt.figure()
    plt.imshow(cov, interpolation="nearest",
               vmin=-1, vmax=1, cmap=plotting.cm.bwr)
    plt.colorbar()
    plt.title("%s / covariance" % title)

    // Display precision matrix
After Change
    display.axes.set_title("%s / covariance" % title)

    // Display precision matrix
    display = plot_matrix(cov, cmap=plotting.cm.bwr,
                          vmin=-span, vmax=span, colorbar=True)
    display.axes.set_title("%s / precision" % title)


////////////////////////////////////////////////////////////////////////////////////////////////////////////////////////////////////////////////////////////

In pattern: SUPERPATTERN
Frequency: 4
Non-data size: 2
Instances
Project Name: nilearn/nilearn
Commit Name: f25d4df0127537d57d4d7f7cd3fa52ca31ffa3ff
Time: 2017-07-28
Author: moritz.boos@uni-oldenburg.de
File Name: examples/03_connectivity/plot_multi_subject_connectome.py
Class Name:
Method Name: plot_matrices
Project Name: nilearn/nilearn
Commit Name: f25d4df0127537d57d4d7f7cd3fa52ca31ffa3ff
Time: 2017-07-28
Author: moritz.boos@uni-oldenburg.de
File Name: examples/03_connectivity/plot_extract_regions_dictlearning_maps.py
Class Name:
Method Name:
Project Name: nilearn/nilearn
Commit Name: f25d4df0127537d57d4d7f7cd3fa52ca31ffa3ff
Time: 2017-07-28
Author: moritz.boos@uni-oldenburg.de
File Name: examples/01_plotting/plot_visualize_megatrawls_netmats.py
Class Name:
Method Name:
