ab65204fbeeaf4423f4bdf15bb24b0c54382496a,tutorials/plot_1-Filtering.py,,,#,35
Before Change
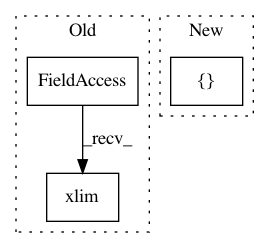
// Plot filtered signal
plot_time_series(times, [sig, sig_filt], ["Raw", "Filtered"])
plt.xlim((2, 5))

//////////////////////////////////////////////////////////////////////////////////////////////////////////////////////////////////////////////////////////////////////////////////////////////////////
//
// Notice that in the filtered time series, the resulting oscillation appears to be
After Change
//////////////////////////////////////////////////////////////////////////////////////////////////////////////////////////////////////////////////////////////////////////////////////////////////////
// Plot filtered signal
plot_time_series(times, [sig, sig_filt], ["Raw", "Filtered"], xlim=[2, 5] )
//////////////////////////////////////////////////////////////////////////////////////////////////////////////////////////////////////////////////////////////////////////////////////////////////////
//In pattern: SUPERPATTERN
Frequency: 3
Non-data size: 3
Instances Project Name: neurodsp-tools/neurodsp
Commit Name: ab65204fbeeaf4423f4bdf15bb24b0c54382496a
Time: 2019-04-09
Author: tdonoghue@ucsd.edu
File Name: tutorials/plot_1-Filtering.py
Class Name:
Method Name:
Project Name: librosa/librosa
Commit Name: 33586a594fa3382f812d3c90751dc00ad0790e16
Time: 2016-06-09
Author: brian.mcfee@nyu.edu
File Name: librosa/display.py
Class Name:
Method Name: waveplot
Project Name: neurodsp-tools/neurodsp
Commit Name: ab65204fbeeaf4423f4bdf15bb24b0c54382496a
Time: 2019-04-09
Author: tdonoghue@ucsd.edu
File Name: tutorials/plot_4-SpectralAnalysis.py
Class Name:
Method Name:
