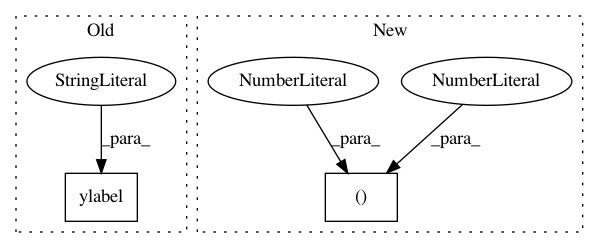
d4a320d3b07fcb7c3030b06ad8351e2df37a6b4a,examples/03_midwest_survey.py,,,#,110
Before Change
import seaborn
ax = seaborn.boxplot(data=pd.DataFrame(all_scores), orient="h")
import matplotlib.pyplot as plt
plt.ylabel("Encoding", size=17)
plt.xlabel("Prediction accuracy", size=17)
plt.yticks(size=17)
plt.tight_layout()
After Change
// ------------------
import seaborn
import matplotlib.pyplot as plt
plt.figure(figsize=(4, 3))
ax = seaborn.boxplot(data=pd.DataFrame(all_scores), orient="h")
plt.ylabel("Encoding", size=20)
plt.xlabel("Prediction accuracy     ", size=20)

In pattern: SUPERPATTERN
Frequency: 3
Non-data size: 2
Instances
Project Name: dirty-cat/dirty_cat
Commit Name: d4a320d3b07fcb7c3030b06ad8351e2df37a6b4a
Time: 2018-06-08
Author: gael.varoquaux@normalesup.org
File Name: examples/03_midwest_survey.py
Class Name:
Method Name:
Project Name: dirty-cat/dirty_cat
Commit Name: d4a320d3b07fcb7c3030b06ad8351e2df37a6b4a
Time: 2018-06-08
Author: gael.varoquaux@normalesup.org
File Name: examples/02_predict_employee_salaries.py
Class Name:
Method Name:
Project Name: neurodsp-tools/neurodsp
Commit Name: 5196910e726c04648f5cffae5f50ecd3171539ce
Time: 2019-03-17
Author: tdonoghue@ucsd.edu
File Name: neurodsp/plts/filt.py
Class Name:
Method Name: plot_frequency_response
